INT. J. REMOTE
SENSING, 2001, VOL. 22, NO. 1, 191-196
THE 7th
September 1999 Athens 5.9Ms earthquake: remote sensing and digital elevation
model inputs towards identifying the seismic fault.
A.
GANAS1*, G.
PAPADOPOULOS2 , S.B. PAVLIDES3.
1. Integrated Information Systems SA, 72-74 Salaminos St., 17675 Athens,
Greece
2. Geodynamics Institute, National Observatory of Athens, PO Box 20048,
11810 Athens Greece
3. Dept. of Geology; Aristotle University of Thessaloniki; 54006 Greece.
ABSTRACT
The meisoseismal area of the
(Ms=5.9) earthquake of 7 September 1999 in Athens, Greece was localized in the
western suburbs of the city (38.1° N, 23.7° E) where no
active faulting had been mapped before.
Here we show that remote sensing can provide conclusive evidence towards
identifying the surface expression of the seismogenic structure. Methods applied were: interpretation of
Landsat TM images, digital overlays of field observations and aftershock
distribution patterns, construction of a 20-m DEM and application of shading
techniques, and comparison with fault plane solutions and dominant slip
direction in striation populations. Our
results imply that the earthquake source is located within the NW-SE trending
valley in the Fili region across the south foothills of Mt Parnitha. The
earthquake occurred along a normal fault with 110° N - 130o N strike, which exhibits
typical morphotectonic features of an active fault.
INTRODUCTION
On Tuesday, 7 September 1999 at the local time
14:56 hrs a moderate-size (Ms=5.9) earthquake occurred near Athens that
inflicted heavy damage upon the Athens Metropolitan area. The area most
severely hit was the municipality of Ano Liosia and Acharnai (figure 1 - see white ellipse). Reliable fault
plane solutions for the main shock were determined automatically by a number of
institutions such as the United States Geological Survey (USGS), California
Institute of Technology (CALT), Harvard University (HARV) and others. Their
solutions can be found on the Internet and they have been communicated around
the world the same day. They clearly show WNW-ESE trending nodal planes (NP),
which have dip-slip normal components:
USGS
NP1: strike=123 Dip= 55, Slip= -84
NP2: 292, 36, -99
CALT NP1: strike=122, Dip = 60, Slip= -80, NP2: 282, 31, -107
HARV
NP1: strike= 114 Dip = 45, Slip= -73,
NP2: 271, 47, -106
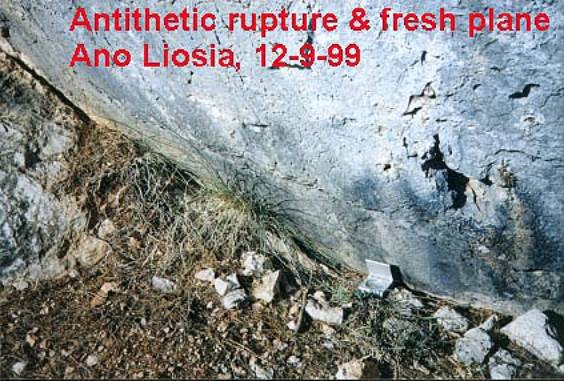
Due to the moderate size of the event no
typical co-seismic ruptures were found (Papadopoulos et al., 2000). This resulted in an uncertainty in locating the
seismic source, despite the fact that ground failure was mapped in a few cases
(figure 2) as gravitational fissures with small throw (2-4 cm, at 38° 05' 47'' N, 23° 40' 56'' E) and as numerous tension cracks.
Therefore, it was difficult to determine which was the active fault without
taking into account other evidence. Such evidence may be provided by digital
image processing of Landsat TM data and computer vision techniques using
high-resolution digital elevation models (e.g. Ganas, 1997).
IMAGE
PROCESSING
A Landsat 5 Thematic Mapper sub-scene (acquired
on 14 September 1993 - path 183 row 34) was used to identify the neotectonic
features of the area. The spatial resolution of the TM sensor is 30 m. The
scene was acquired from the Fucino receiving station at the system-corrected
level. The EASI PACE software was used for image processing. First, to remove
radiometric noise the scene was filtered with a Fast Fourier transform. Then,
the image was georeferenced to the Greek national projection system (EGSA) by a
2nd order polynomial transformation. The ground control points were collected
from recent, 1:50,000 maps (Hellenic Army Geographical Service, 1988, 1992).
The rms error measured on the ground control points was less than a pixel. The
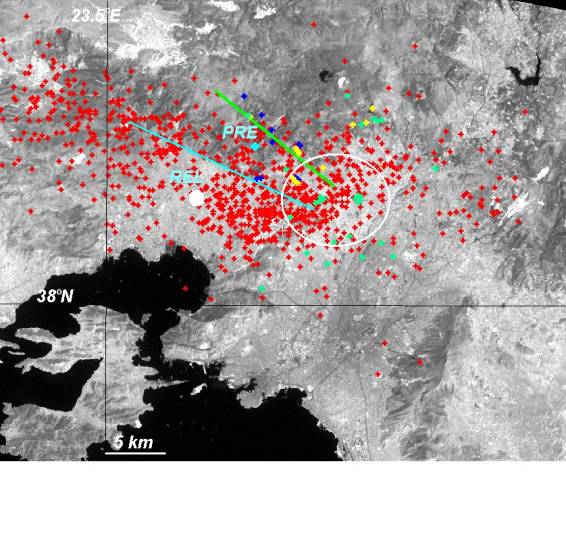
image was used as a raster, monochromatic (linearly stretched band 5)
background to overlay vector files of point character representing localities
of field observations (figure 1). These observations were collected a few days
after the earthquake using a hand-held GPS with a planimetric accuracy of ±60 m. The field data were collected in the
horizontal datum WGS84 and were converted to the EGSA projection system using
the public domain DTCC4.1 software.
Following georeferencing a series of 3D
visualisation snapshots (Figure 3) were produced using a false colour composite
combination (RGB 741) adjusted to a 20-m Digital Elevation model (DEM). The DEM
was produced by on-screen digitising of elevation contours of the 1:50,000 map
sheet "Elefsis" (contour interval 20 m). The model was constructed at
20 m spacing to eliminate interpolation errors in image space between the
contours (the procedure is described in Ganas and Athanassiou, 2000). The
degree of co-registration was better than a TM pixel.
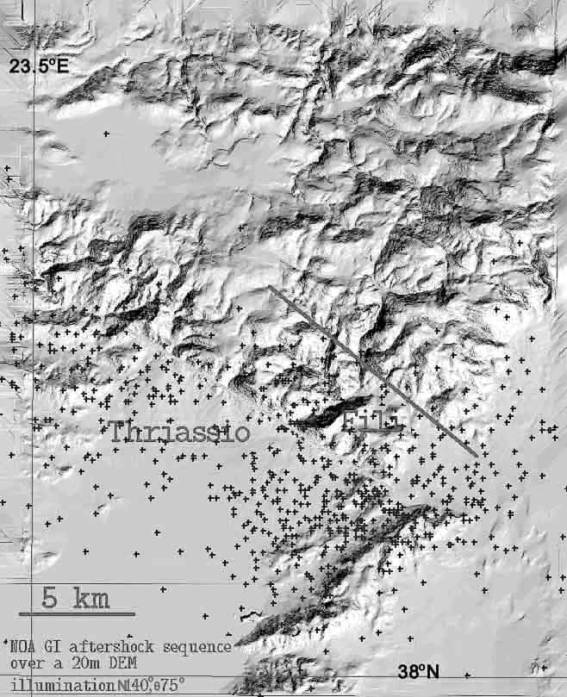
In addition, shaded relief images were produced
using various illumination conditions in order to study the long term evolution
of landforms in the meisoseismal area. The shaded relief image (figure 4) that
simulates a low sun angle (zenith=75°), southeastern viewing direction (140° N) can be used as a raster background to
overlay vector files like the shallow aftershock sequence provided by the
National Observatory of Athens Geodynamics Institute (NOAGI-black crosses).
This is because in central Greece the predominant extension direction is north-south
so a south-eastern illumination accentuates topography better.
DEMs
AND LANDSAT TM INTERPRETATION
The feature that dominates the area is the
Thriassion fault segment, which is a WNW-ESE striking, south-west dipping normal
fault (figure 3; view to the north-east). It comprises the northern border of
Thriassion plain and is covered by typical talus cones and scree. An almost parallel segment lies 5 km to the
north-east. It is the Fili fault (figure 3-red line) that is shown in the IGME's geological map (IGME, 1980) as
bordering (to the north) the small Neogene basin of Fili. Both faults terminate against the transverse
limestone ridges of the Egaleo Mountain.
The Thriassion normal fault segment is a
possible candidate for the 7/9/99 seismogenic structure due to its linearity
(in map view) and its relief, however, this fault in the field looks
"old", as it is characterised by eroded scarps, and undisturbed
alluvial fans. Moreover, in the whole area bounded by the Thriassion fault the
seismic damage was less extensive (see green crosses in figure 1) and the
overlay of the 2-month aftershock sequence pattern shows that many events plot
in the footwall of Thriassion, whereas almost all events plot in the
hangingwall of Fili segment. Note that the aftershock epicentres are associated
with an accuracy of ± 1000 m (in x-y-z)
because of the good geometry and density of the local seismographic network
setup by NOAGI.
On the other hand, the Fili Fault is expressed
as an abrupt linear front for a distance of about 6 km in the general SE-NW
direction (figures 3, 4), closer to the localities of mapped rock falls (figure
1) and gravitational breaks (figure 2). The good alignment of ridges against
this front indicates that the fault is active and dips to the south-west.
Furthermore, other NW-SE, dominant features can be seen on the shaded relief
image to occur only to the far north (15 km) of the meisoseismal area. In
addition, no NE-SW faults are seen to cross-cut these features.
CONCLUSIONS
We consider our results to indicate co-seismic
movement along the Fili fault plane on the basis:
1)
The spatial
distribution of about 1020 aftershocks (figure 1) indicates that the Fili fault
geometry defines better the seismic source. The hypocentres of the aftershocks
are shallow (5-20 km) and are mostly located in the hangingwall of the Fili
fault;
2)
The first nodal
plane (NP1) strikes parallel to the Fili fault plane which also has a high dip
angle, as expected for normal faults;
3)
The relocated
epicentre of the mainshock (see white spot in figure 1; depth 16.8 km) fits the
south-west dip direction of the Fili Fault;
4)
The DEM also
shows two linear features dipping to the south-west in the area to the north of
the epicentre (figure 4);
5)
From remote
sensing the visible length of the fault is estimated to be about 8-10 km, which
is comparable to the length of the seismic source of the 7/9/1999 earthquake (5
to 8 km), as predicted from empirical, earthquake magnitude-surface rupture length
relationships (Wells & Coppersmith, 1994).
6)
Striation data
were also collected from steep scarps along the Fili fault, striking 120° N on average (Pavlides et al., 1999), bearing polished fault surfaces cutting mainly
trough basement crystalline limestone and occasionally through cemented
limestone breccia. The polished surfaces indicate very young, normal dip-slip
movement reactivation with strikes ranging 110° N - 130° N, dipping 70-80° towards the south-west and rake -76 to -88.
Thus, the co-seismic structure of the Athens
September 1999 shock can be identified as the 10 km long, WNW-ESE striking and
SW dipping Fili fault. This moderate-size event demonstrated that, the
identification of the topographic expression of the seismogenic structure requires
a multi-disciplinary approach. The role of remote sensing is to map the large
features (the probable candidates) using photo-interpretation, combine this
information with field observations using simple GIS techniques to pinpoint the
extent of the meisoseismal area and display the spatial distribution of
aftershocks that confine the seismogenic volume which "hosted" the
earthquake.
AcknowledgEments
The authors would like to thank George
Stavrakakis, Director, Institute of Geodynamics, National Observatory of
Athens, for providing the aftershock data. Thanks are also due to two anonymous
reviewers. System-corrected Landsat TM data were supplied from the archive of
IIS SA.
REFERENCES
GANAS, A., 1997, Fault segmentation and seismic
hazard assessment in the gulf of Evia rift, central Greece. Unpublished PhD
thesis, The University of Reading, Reading, 370 p.
GANAS, A., and ATHANASSIOU, E., 2000. A
comparative study on the production of satellite orthoimagery for geological
remote sensing. Geocarto International, 15, 51-59.
Hellenic Army Geographical Service, 1992.,
1:50,000 Map Sheet "Elefsis", Athens.
Hellenic Army Geographical Service, 1988,
1:50,000 Map Sheet "Kifisia", Athens.
IGME, 1980, Geological map of Greece,
"Athinai-Elefsis" sheet (1:50,000), Athens.
PAPADOPOULOS, G.A., DRAKATOS, G.,
PAPANASTASIOU, D., KALOGERAS, I., STAVRAKAKIS, G., 2000, Preliminary results
about the catastrophic earthquake of 7 September 1999 in Athens, Greece.
Seismological Research Letters, 71,
318-329.
PAVLIDES, S.B., PAPADOPOULOS, G.A., and GANAS,
A., 1999, The 7th
September 1999 unexpected earthquake of Athens : preliminary results on the
seismotectonic environment. In Proceedings
of 1st Conference on Advances on Natural Hazards Mitigation:
Experiences from Europe and Japan (G. A Papadopoulos, Editor, Athens, 3-4
November 1999) , pp. 80-85.
WELLS, D. L. and COPPERSMITH, J. K. 1994, New
empirical relationships among magnitude, rupture length, rupture width, rupture
area, and surface displacement. Bulletin
Seismological Society of America, 84,
974-1002.
LIST
OF FIGURES
Figure
1. The spatial distribution of
the aftershocks (red crosses) of the Athens earthquake. Green line is the Fili
Normal Fault (dip to the south-west), cyan line is Thriasio Normal Fault (dip
to the south-west), blue crosses are rock falls, green crosses are locations of
serious damage (building collapse or heavy structural damage), yellow crosses
are surface breaks and the black line is the LON/LAT grid. PRE is the
preliminary NOAGI epicentre of the main shock, REL is the relocated NOAGI
epicentre. Area enclosed within the white ellipse is the meisoseismal area of
the earthquake.
Figure
2. Field photograph of the
gravitational surface breaks in Ano Liosia. The locality was visited on the
12-9-1999 (5 days after the event) and are close to Fili town (local name
"Platoma"). The movement is between 2-4 cm, down to the northeast.
Figure
3. Perspective view (towards
north-east at 35° above the horizon)
of Athens. The image was constructed using computer vision techniques, TM
imagery (741 RGB) and a 20-m DEM. Red line is the trace of the Fili normal
fault that moved during the 7/9/1999 earthquake. Exaggeration x 3.
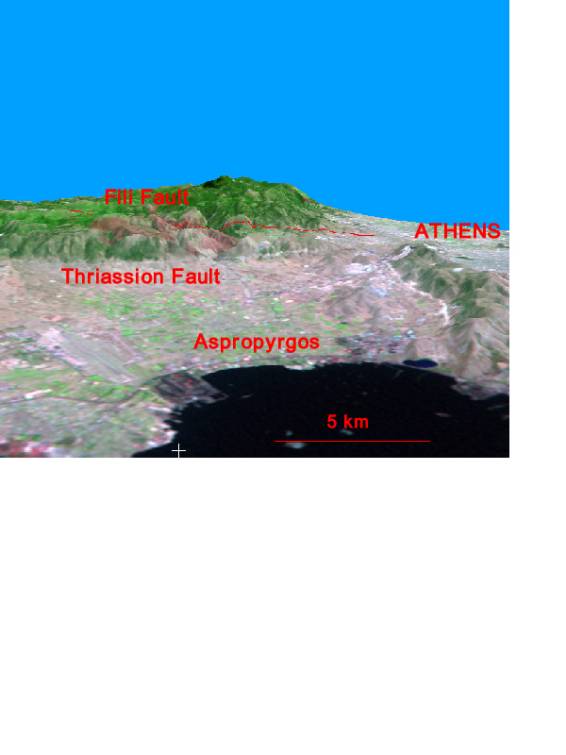
Figure 4. Shaded relief image of a
20-m DEM of the meisoseismal area in Athens. The shading simulates orientation
of topography with respect to an illumination source (illumination comes from
the south-east and a zenith angle of 75°). Light gray line is the Thriassion normal fault, black line is the
Fili normal fault. Black crosses are aftershock epicentres provided by NOAGI.