| |
|
|
|
|---|---|---|---|
| | |||

|
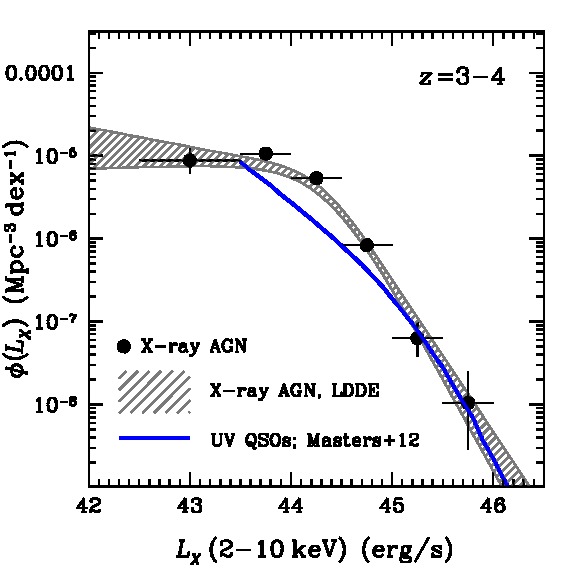
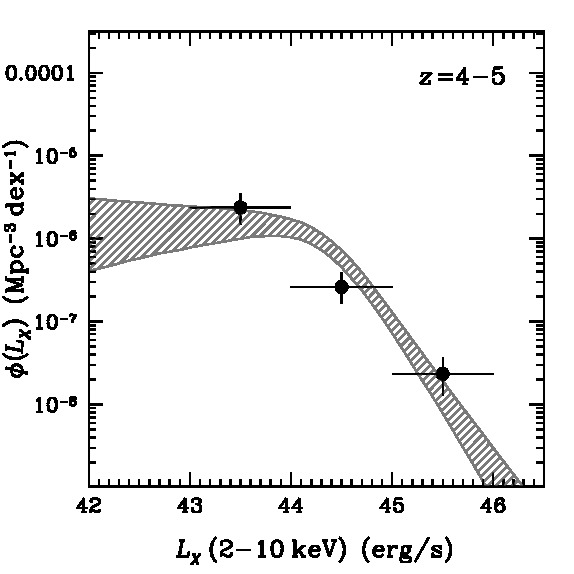
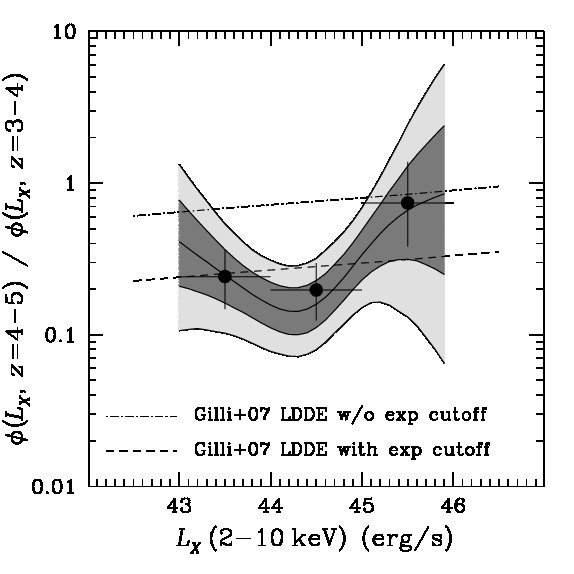
The AGN X-ray luminosity function at z=3-5 The X-ray luminosity function of AGN evolves rapidly at redshifts z>3. There is nearly a factor of 5 drop in AGN space density between z=3.5 and z=4.5. The top plots show the X-ray luminosity function (gray-shaded region and black data points) in two redshift intervals, z=3-4 and z=4-5. These are estimated using a large sample of X-ray selected AGN (total of 340 at z>3; the largest as of mid-2015) from both deep (e.g. COSMOS, AEGIS, Chandra Deep Fields) and wide-area/shallow XMM surveys (XMM-XXL). The black circles are non-parametric measures of the X-ray luminosity function. Shaded regions correspond to a particular parametric model for the form and evolution of the luminosity function (Luminosity Dependent Density Evolution). The bottom plot shows the ratio between the X-ray luminosity functions at redshift z=4-5 and z=3-4. It shows that the space density of AGN drops by nearly a factor of 5 between the two redshift intervals. There is also evidence that the evolution of AGN at z>3 is luminosity dependent. Systems with accretion luminosities LX>1045erg/s evolve less strongly than less luminous sources. This can be interpreted as evidence that more massive black holes form earlier than smaller ones. This is also reminiscent of similar trends established at lower redshift. More details in Georgakakis et al. (2015). |
|---|---|

|
|

|
| | |||
|---|---|---|---|
| |
|
|
|