|
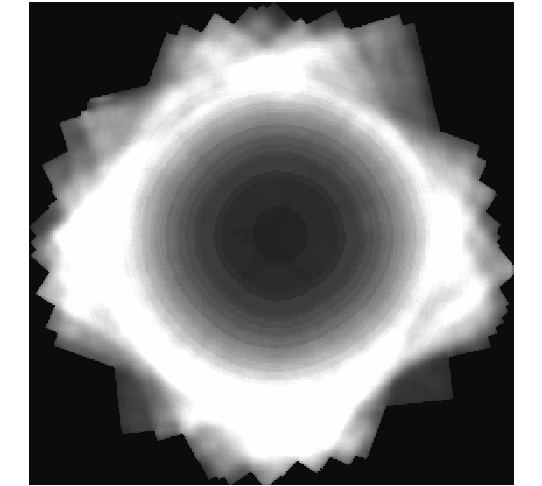
X-ray observations suffer complex instrumental effects that have
a strong impact on the detection probability of point sources. The
size and the shape of the Point Spread Function (PSF) for example,
vary across the detector, while the sensitivity decreases from the
centre to the edge of the field of view. Also, the application of
any source detection software on an X-ray image introduces biases.
Brighter sources have a higher probability of detection compared to
fainter ones. Background fluctuations result in spurious detections
that are inevitably present in any X-ray catalogue. Statistical
variations of the source counts combined with the steep logN-logS of
the X-ray source population result in brighter measured fluxes for
the detected sources compared to their intrinsic ones (Eddington
bias). For a wide range of applications it is important to quantify
these effects accurately to understand the type of sources a given
X-ray observation is (or is not) sensitive to.
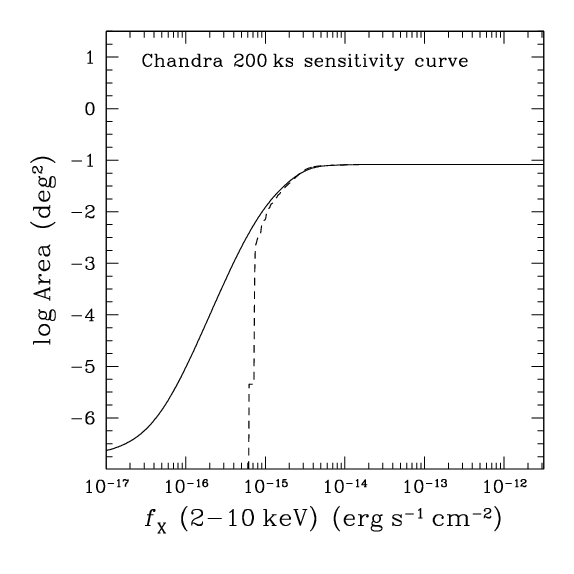
We have developed a Bayesian method for determining the
sensitivity map of an X-ray imaging observation, which correctly
accounts for the effects above and provides an accurate estimate of
the probability that a source with a flux fX in a certain
energy band will be detected across the detector area (Georgakakis
et al. 2008). This method is used to estimate the X-ray source
counts. Because we correctly account for the completeness and flux
bias corrections, particularly for sources with few photons close to
the detection limit of a given survey, we have been able to extend
previous determinations of the logN-logS to fluxes that are 1.5-2
times fainter.
| 
